U.S. Cities Leading in Mental Health Support

Finding a therapist in the United States depends heavily on where you live. Your city affects how long you wait for an appointment, whether local clinicians accept your insurance, and whether the cost of care is realistic for your budget.
To identify where access is strongest and where obstacles cluster, Grow Therapy evaluated the 50 largest U.S. cities using eight measures:
- Provider availability
- Federal mental health provider shortage scores (HPSA)
- Uninsured rates
- Housing costs relative to income (rent burden)
- Income inequality (Gini coefficient)
- Broadband access
- Violent crime rates
- Access to parks and green space
Each factor was chosen because it influences whether people can obtain timely, affordable mental health care. Provider counts and federal shortage scores indicate supply relative to need. Uninsured rates and rent burden reflect affordability. Broadband matters because telehealth has become a primary way many people connect with therapists—limited internet access reduces that option. Finally, park access and crime rates describe environmental conditions that affect stress and overall mental well-being.
Did you know?
The national average wait time for behavioral health services is 48 days — nearly seven weeks.
Key takeaways
- San Francisco, Seattle, and Austin, TX lead the list of U.S. cities with the strongest mental health support.
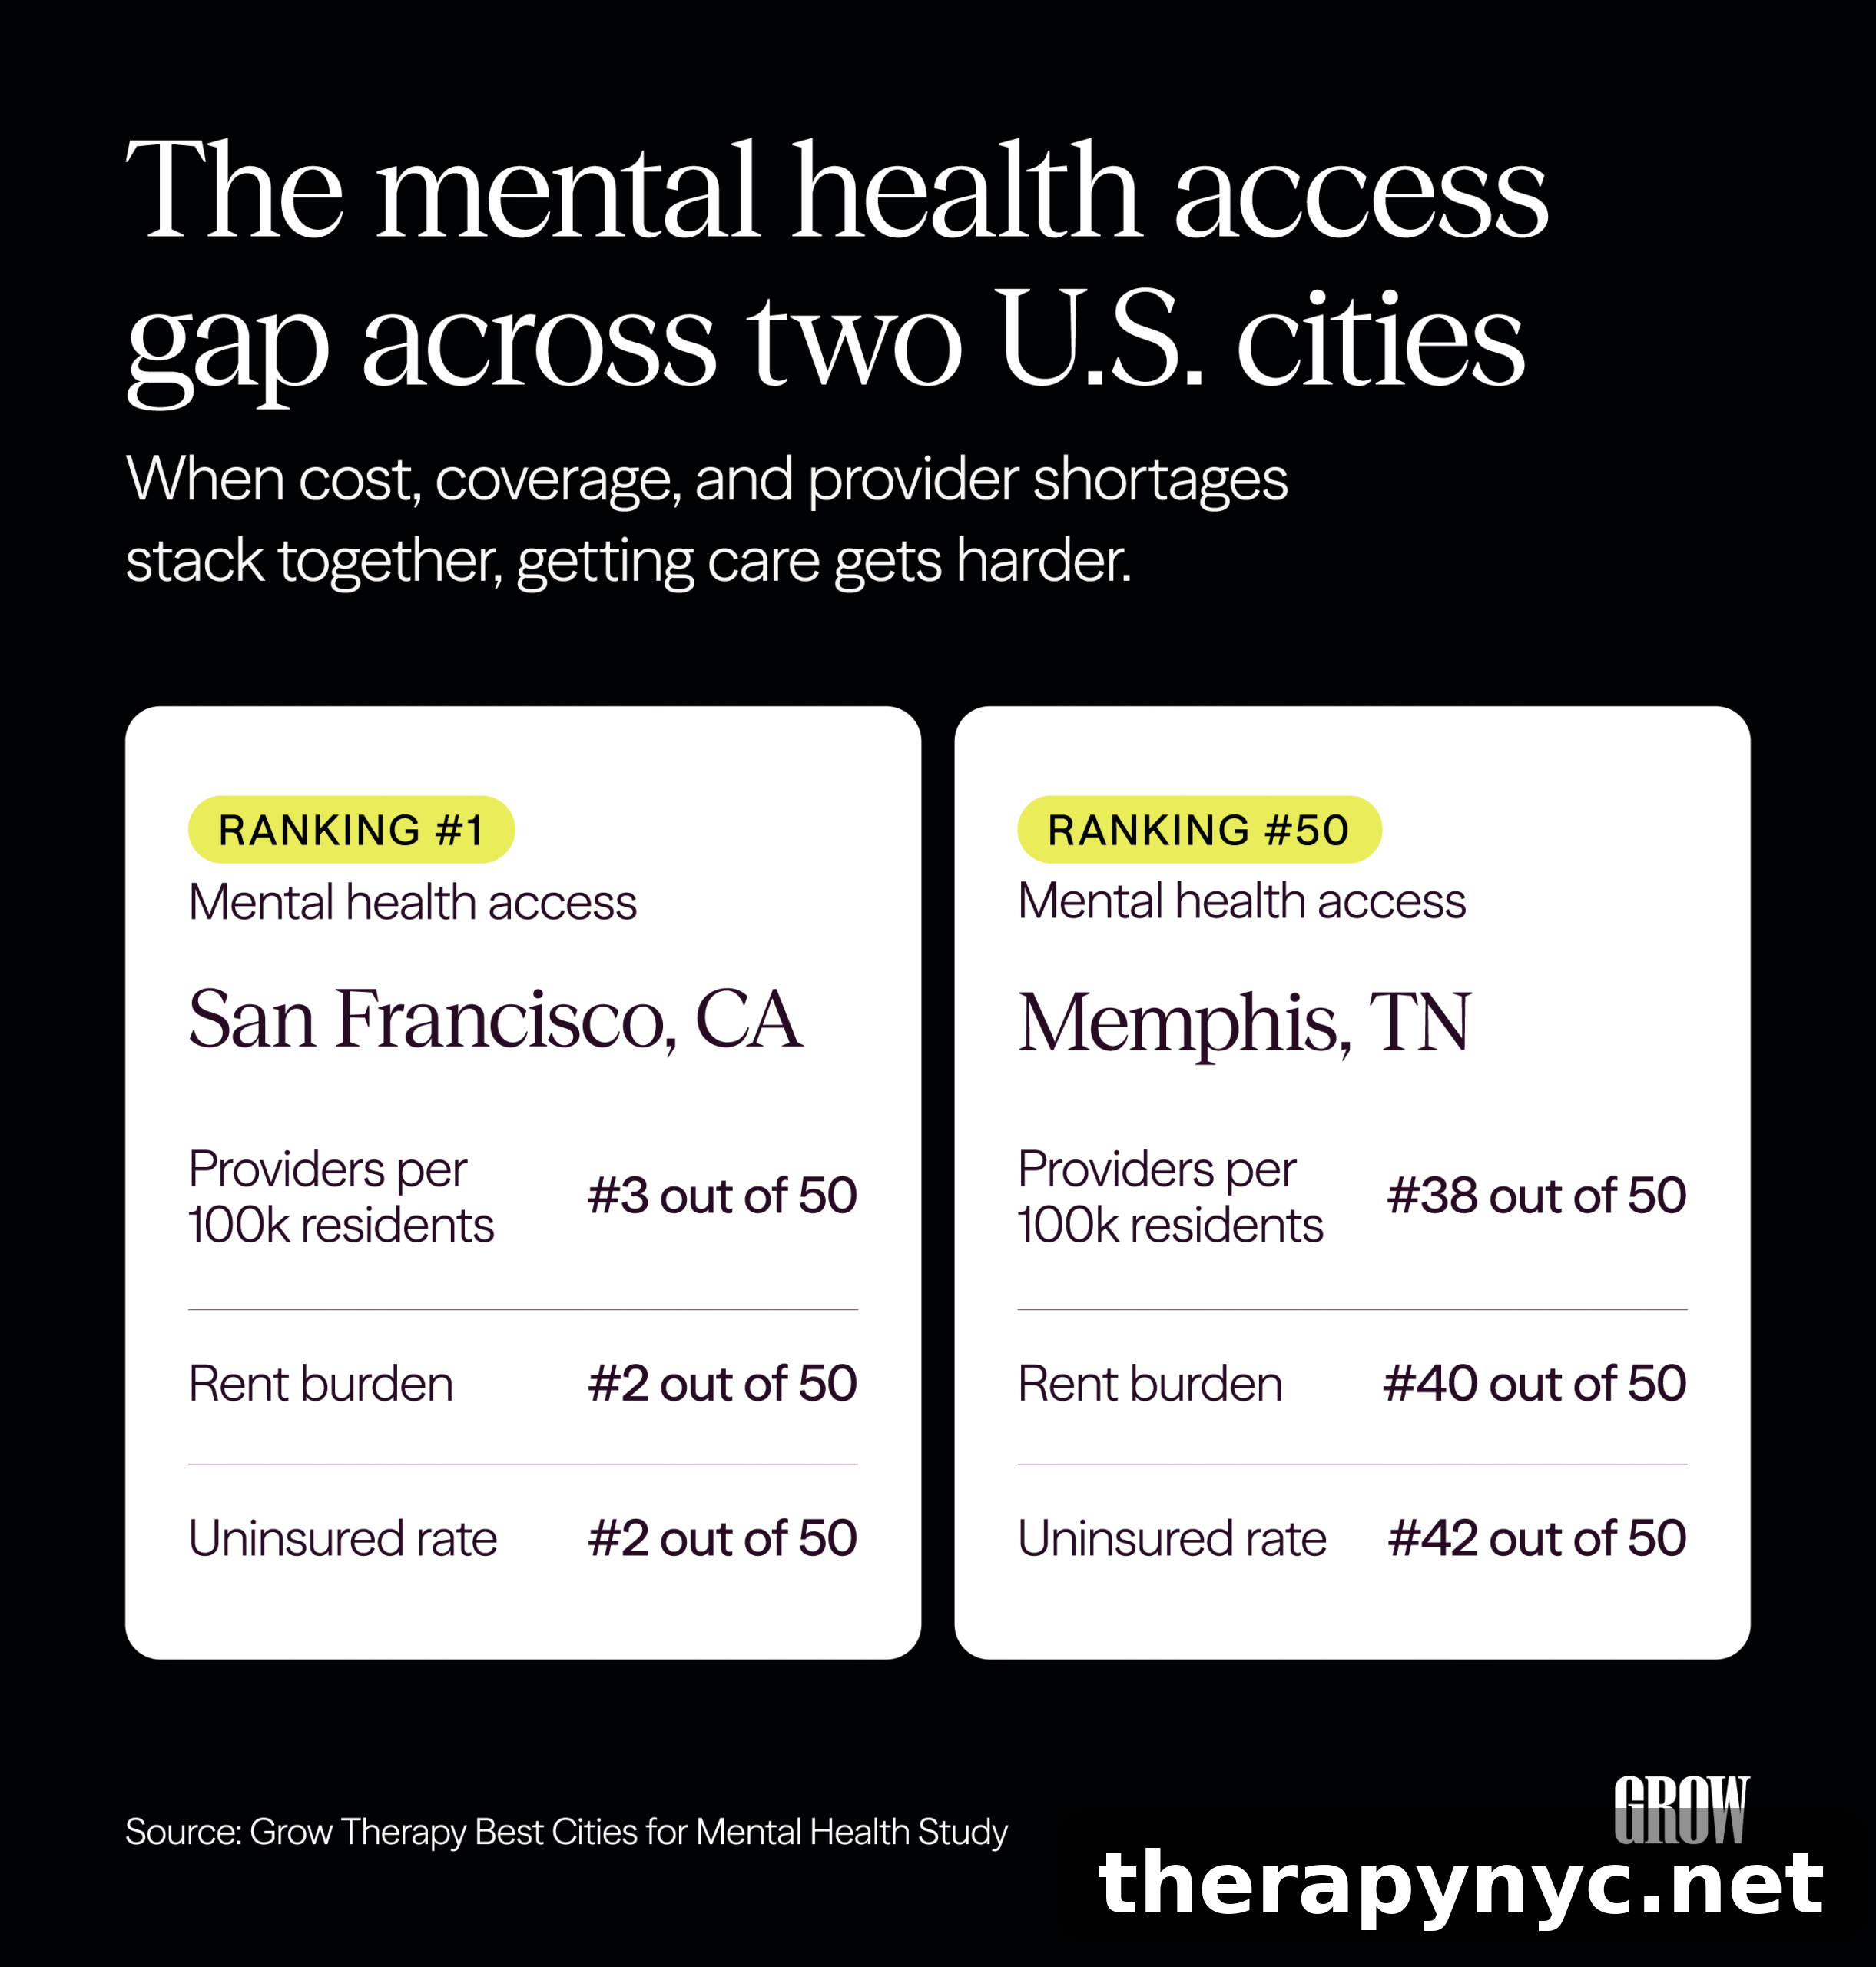
- Memphis (#50) exemplifies stacked barriers: high violent crime, low broadband access, heavy rent burdens, and marked income inequality combine to reduce access.
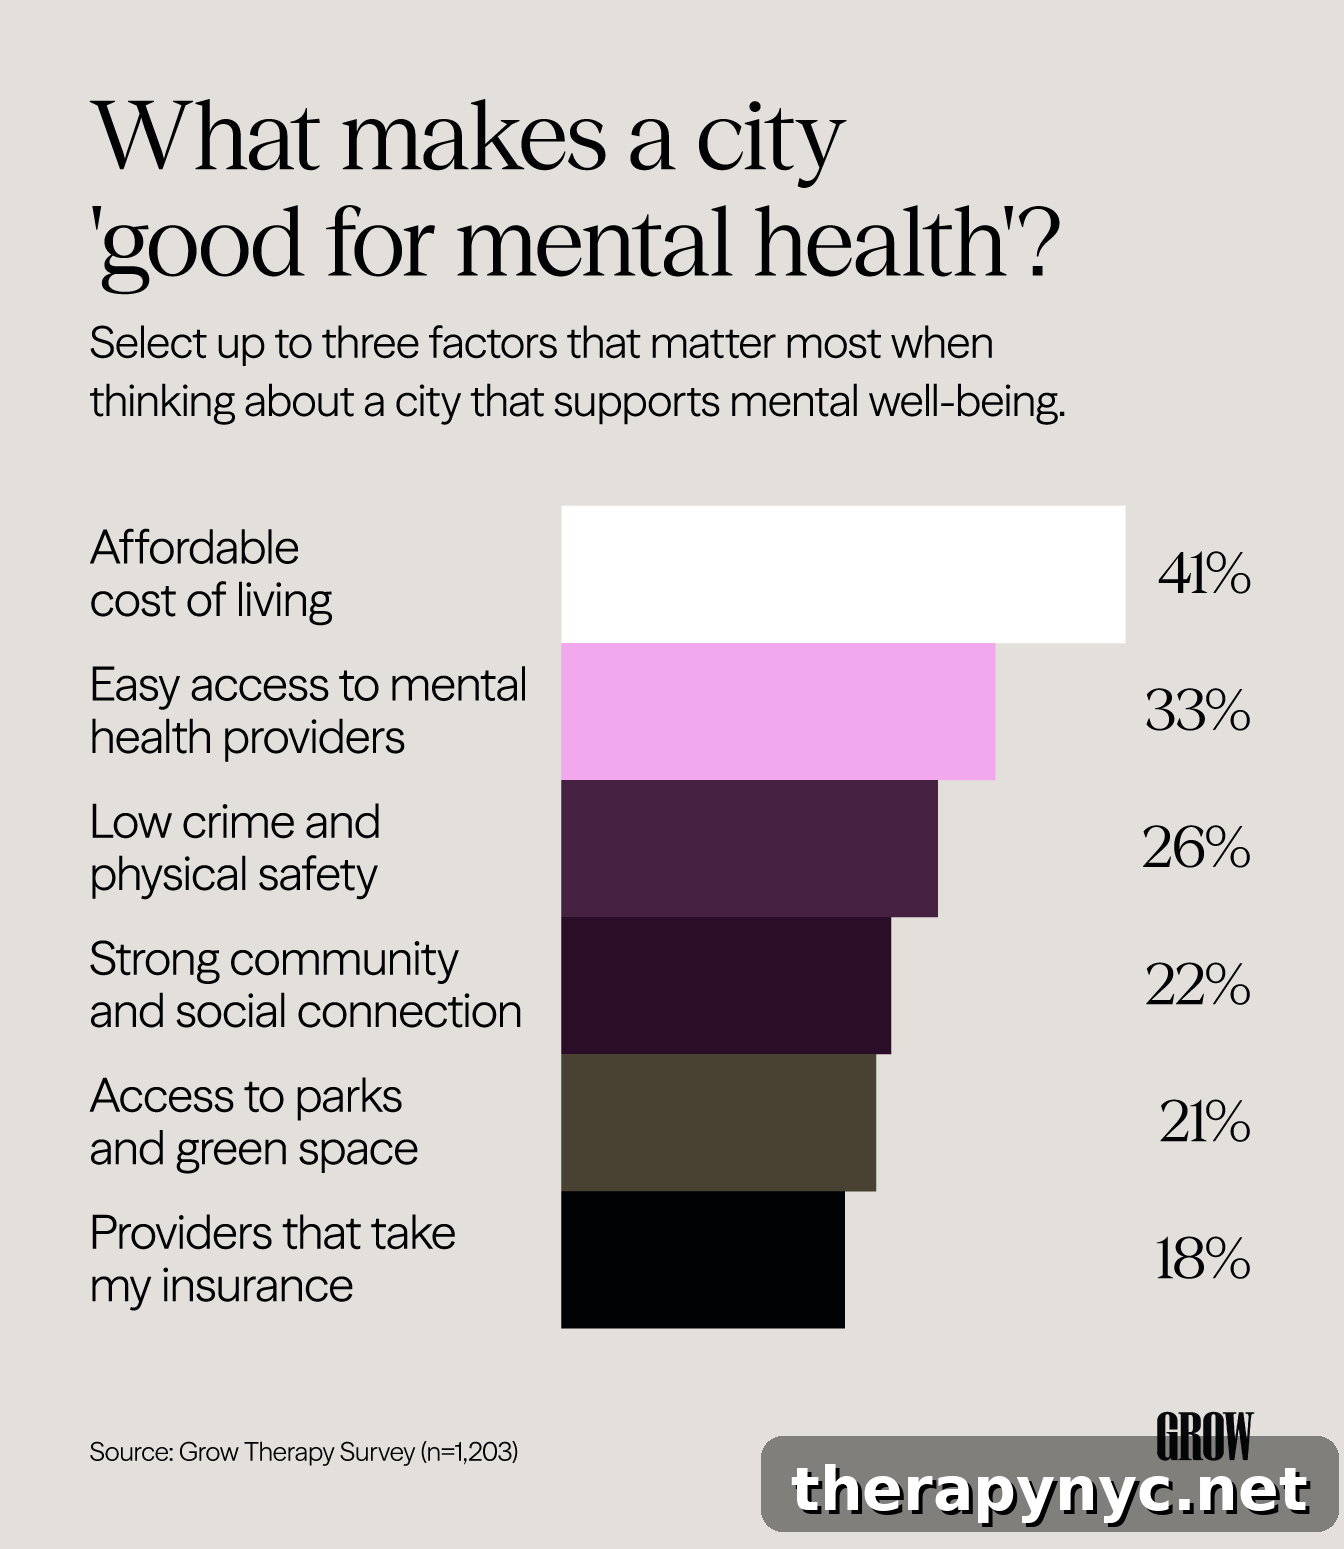
- Cost of living (41%), provider access (33%), and safety (26%) were the factors Americans most often named as essential for a mentally healthy city.
- One in five Americans (21%) has skipped mental health care because out-of-pocket costs were too high; others face uncertainty about insurance coverage.
The best U.S. cities for mental health support
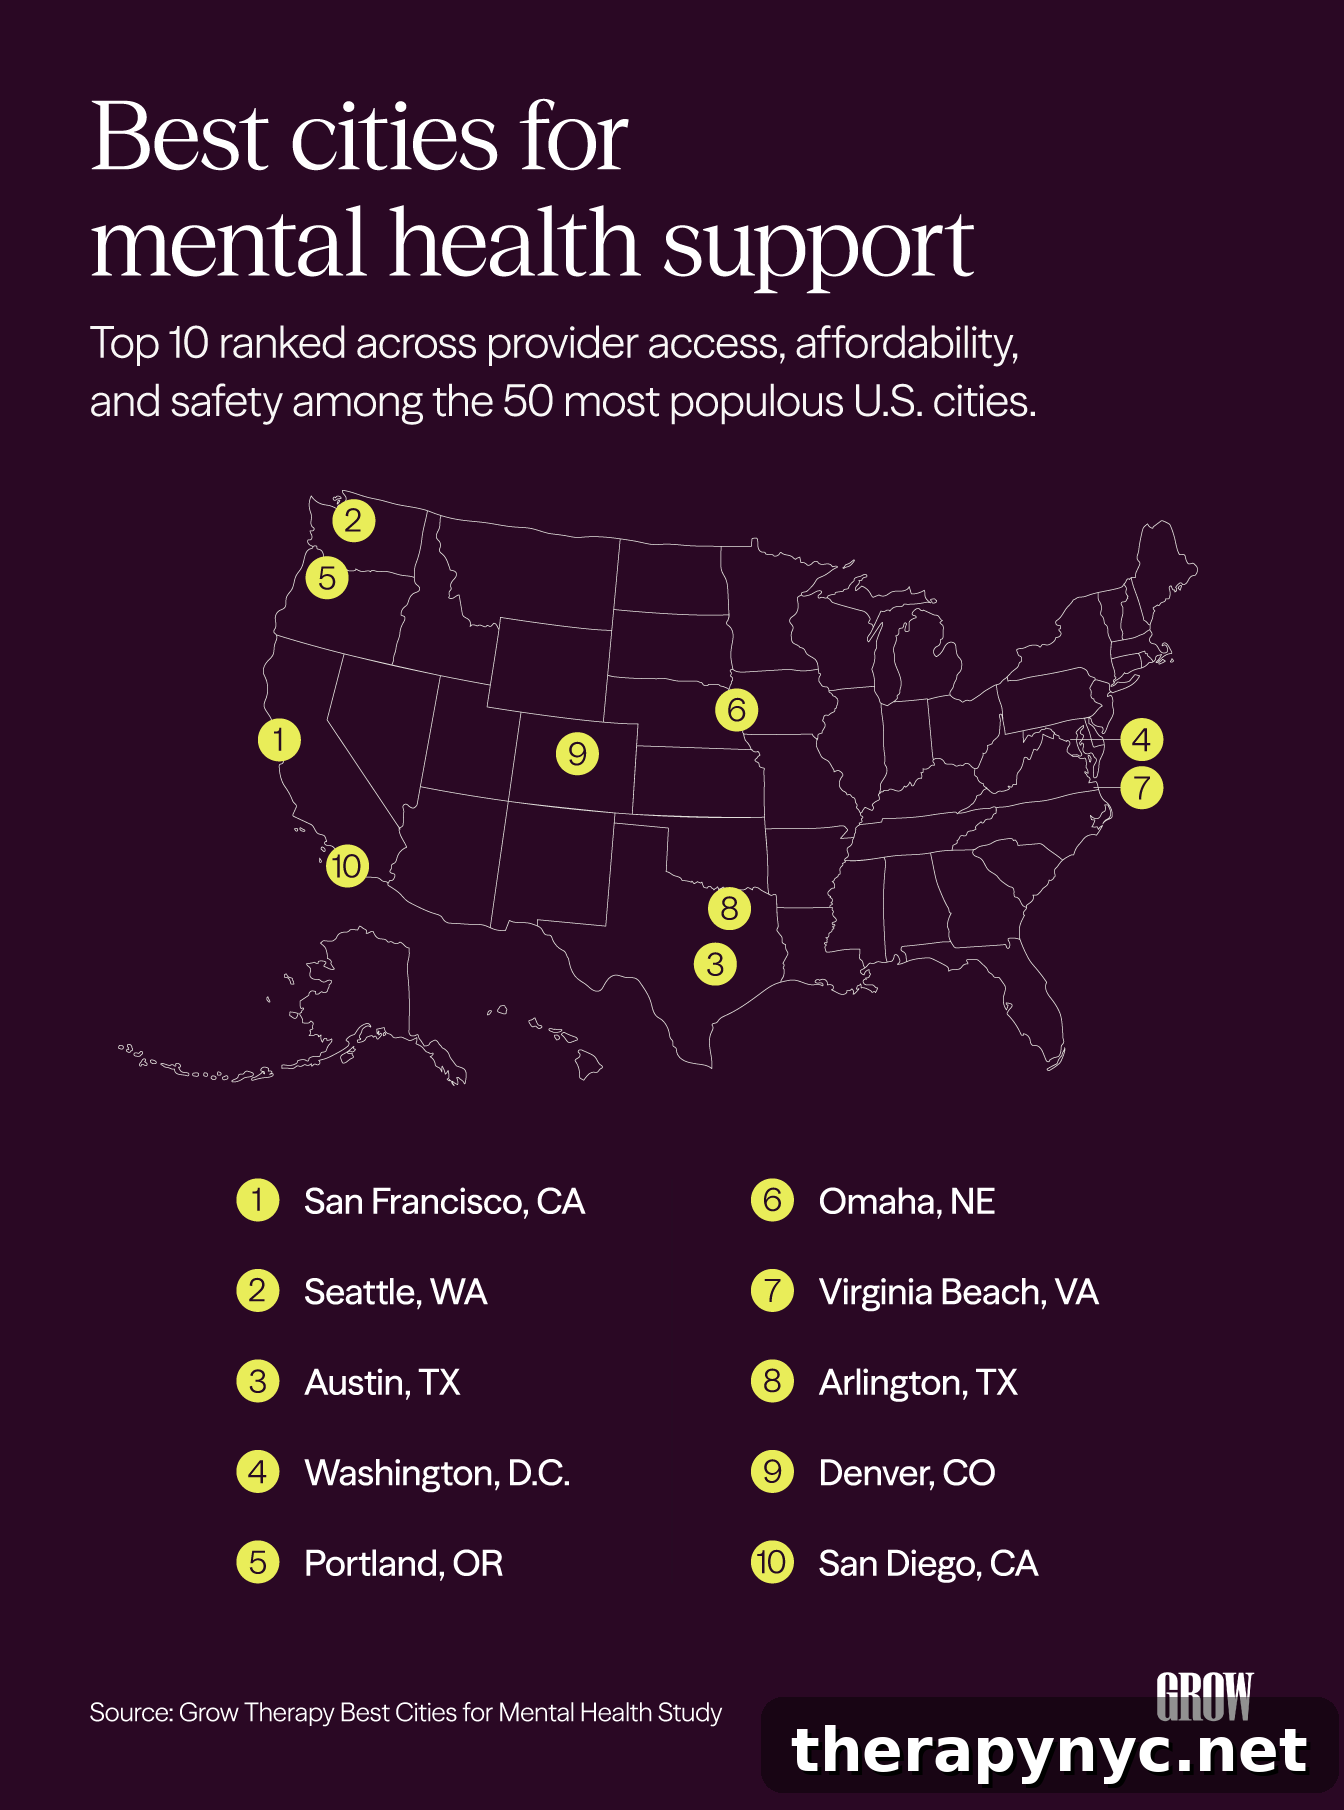
Top-ranked cities don’t win by excelling in a single area. They balance availability, affordability, and safety so residents can realistically access care. The table below lists the top 10 cities and the pages that follow explain which factors most influenced each ranking.
| Ranking | City |
|---|---|
| 1 | San Francisco, California |
| 2 | Seattle, Washington |
| 3 | Austin, Texas |
| 4 | Washington D.C. |
| 5 | Portland, Oregon |
| 6 | Omaha, Nebraska |
| 7 | Virginia Beach, Virginia |
| 8 | Arlington, Texas |
| 9 | Denver, Colorado |
| 10 | San Diego, California |
1. San Francisco, CA — provider access and housing affordability converge
San Francisco tops the list by pairing a high concentration of mental health providers with a relatively moderate rent burden when measured as the share of income spent on housing. High median incomes offset steep rents, so many renters spend a share of income on housing that is closer to the national average. Strong broadband and excellent park access further support both in-person and virtual care options.
| Provider density | #3 — third-highest mental health providers per 100k residents |
| Rent burden | #2 — second-lowest share of cost-burdened renters in the dataset |
| Broadband | #8 — strong household broadband access supports telehealth |
| Park access | Nearly all residents live within a 10-minute walk of a park — the highest in the dataset |
2. Seattle, WA — the telehealth-ready city
Seattle’s combination of a solid provider base and the highest broadband access among cities studied makes it exceptionally well-positioned for both in-person and virtual care. Consistent performance across metrics — including a competitive rent burden — drives its high ranking.
| Broadband access | #1 — highest household broadband access, improving telehealth access for many residents |
| Rent burden | #4 — lower than many expect for a coastal city |
| Provider density | #12 — solid mid-upper range; consistent across pillars |
| HPSA score | #6 — lower federal shortage designation, indicating a better alignment of supply to need |
3. Austin, TX — strong access, low crime, and competitive affordability
Austin ranks highly because it combines a low federal mental health shortage score with a below-average violent crime rate for its size. It’s the top Texas city in the study and one of the few Sun Belt metros that score well on both access and safety. One limitation: a higher uninsured rate makes care harder to reach for those without coverage.
| HPSA score | #2 — supply aligns better with population need than in many similar metros |
| Violent crime rate | #10 — well below average for a metro of its size |
| Provider density | #17 — middle of the pack, but supported by low shortage severity |
| Rent burden | #9 — competitive for a fast-growing metro |
| Uninsured rate | #34 — a constraint for residents without coverage |
4. Washington, DC — the coverage advantage
Washington, DC demonstrates how broad insurance coverage can support access. It has the lowest uninsured rate among the cities studied and a high provider density, aided by a government-heavy employer base that boosts coverage. A mid-range violent crime rate prevents an even higher finish.
| Uninsured rate | #1 — the lowest uninsured rate in the study |
| Provider density | #5 — fifth-highest providers per 100k residents |
| Income equality | #4 — relatively even income distribution |
| Violent crime rate | #37 — keeps DC out of the top three |
#5. Portland, OR — consistent across every pillar
Portland scores well across provider density, low uninsured rates, and broadband access. Mid-range violent crime and relatively wide income inequality limit how evenly those benefits are felt across the population.
| Provider density | #6 — sixth-highest per 100k residents |
| Uninsured rate | #6 — among the lowest uninsured rates in the study |
| Broadband access | #8 — solid support for telehealth |
| Rent burden | #10 — housing costs manageable relative to income |
| Violent crime rate | #27 — mid-range |
| Income equality | #28 — the widest income gap in this top-five group |
What makes a city ‘good for mental health’ — and what the data confirms
Survey respondents ranked affordable cost of living, access to providers, and physical safety as the top attributes of a mentally healthy city. The data supports those priorities: cities that balance affordability, provider supply, and safety place highest in the rankings.
Provider access matters — but it’s not the whole story
One-third of Americans said easy access to providers is a top priority. Cities with the highest provider density don’t always finish at the top because housing costs and income inequality can offset that advantage. For example, New York leads in provider density but finishes lower overall due to affordability and inequality pressures.
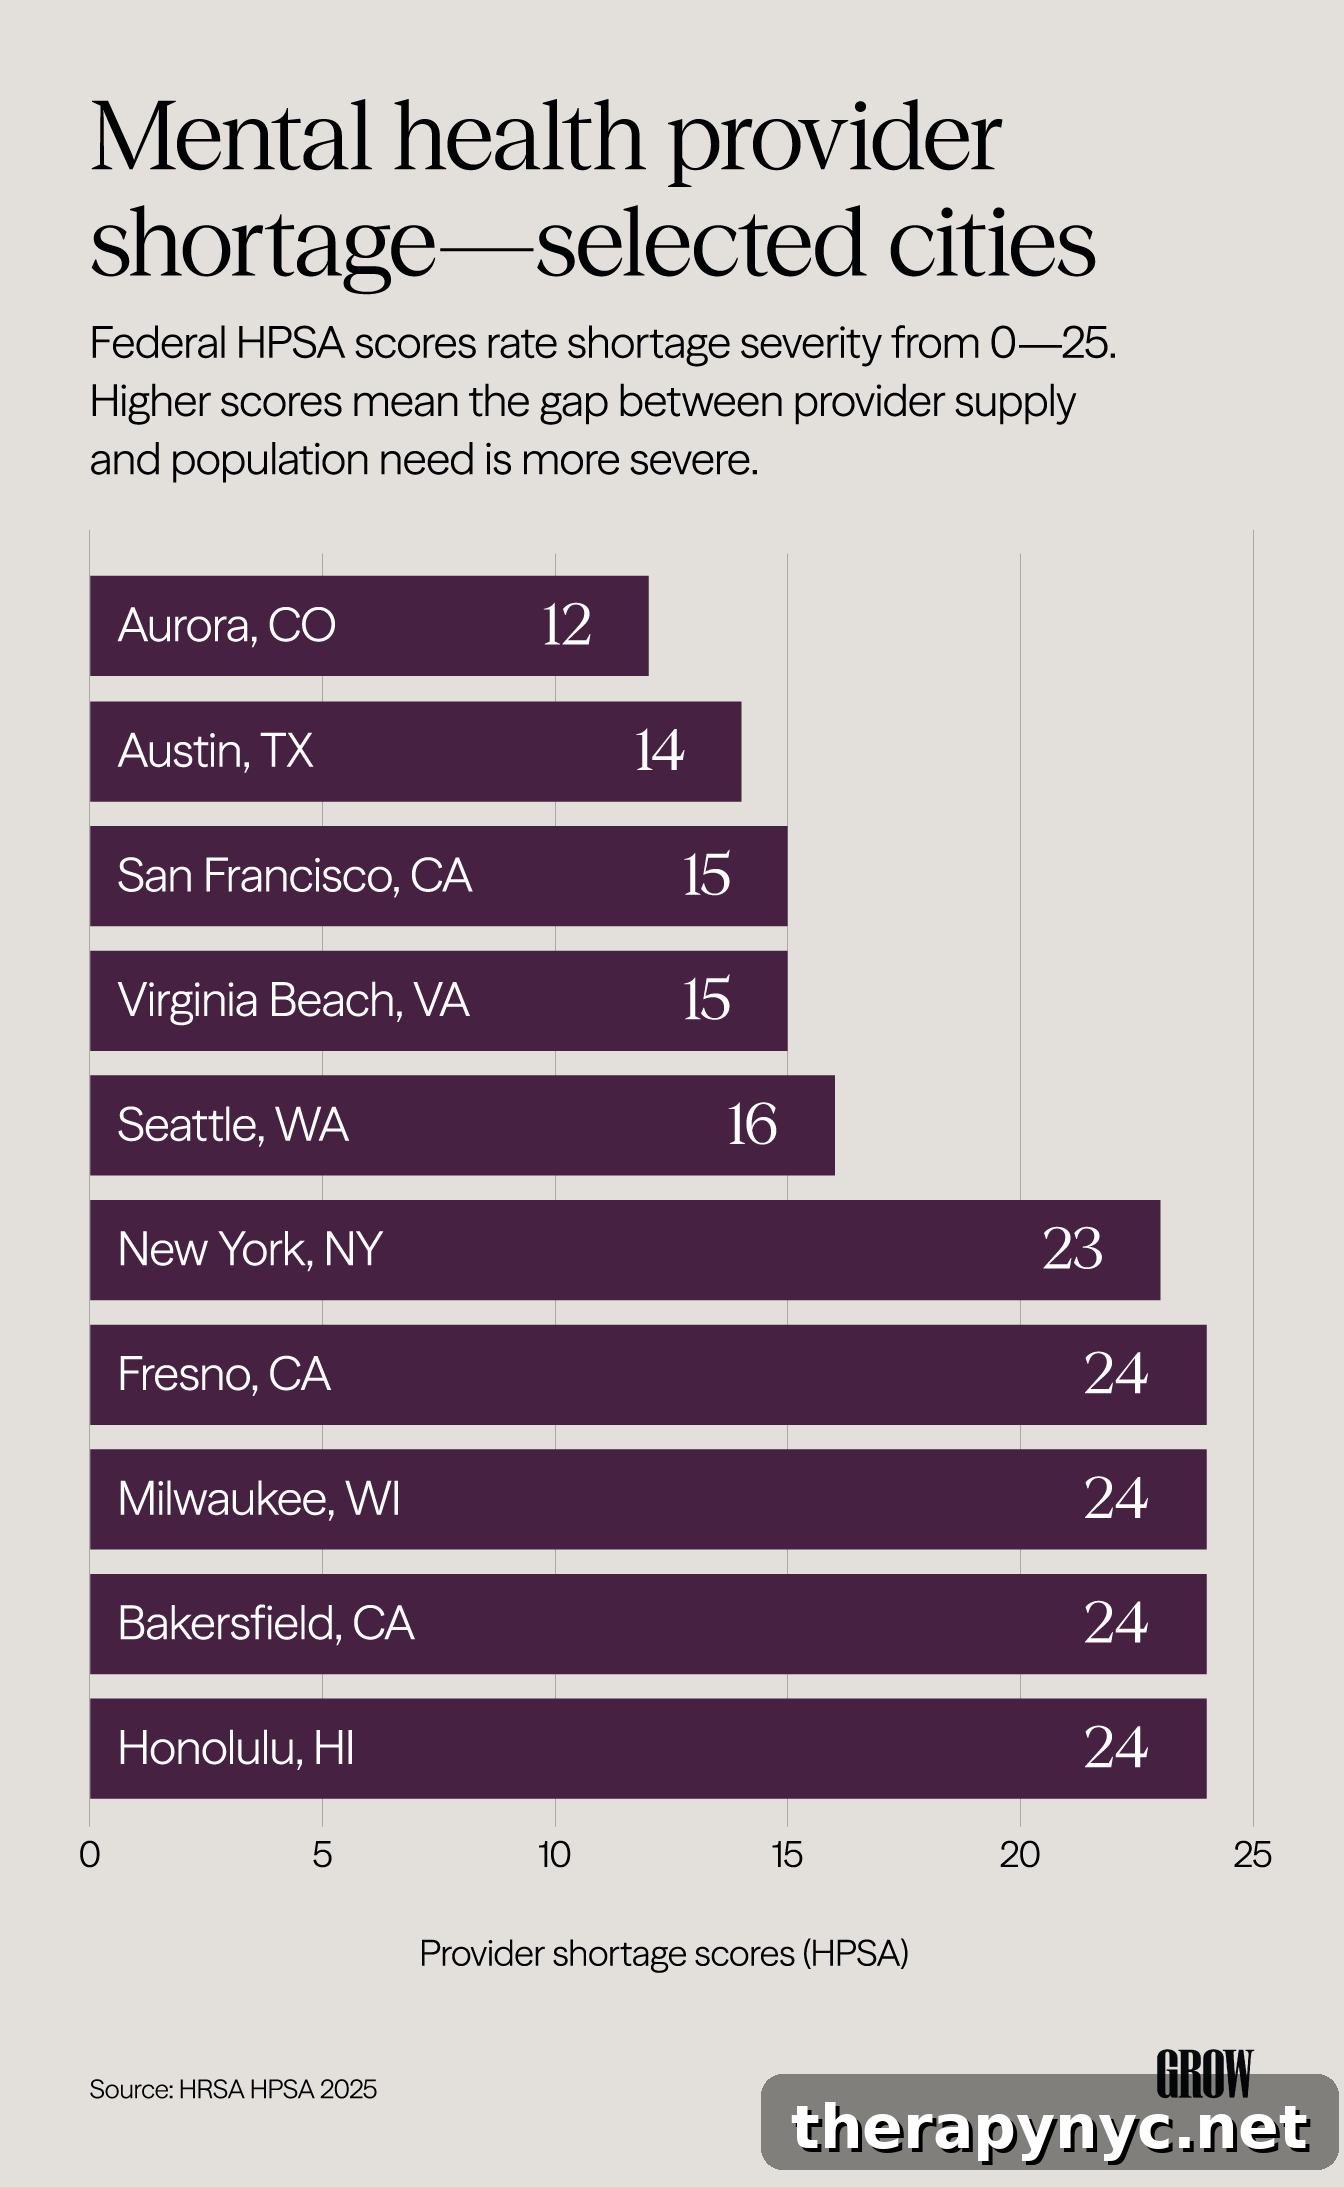
Federal HPSA scores provide a complementary view: they indicate where provider shortages are federally recognized and how severe those shortages are on a 0–25 scale. Some cities show relatively low shortage scores, while others face more severe gaps. High HPSA scores don’t doom a city’s overall result if other supports—like low uninsured rates or low crime—compensate.
Affordability runs through almost every top-ranked city
Affordable housing and predictable out-of-pocket costs are central to access. Cities with low rent burdens and strong insurance coverage tend to rank higher. But coverage alone is not enough—people also need confidence and clarity about how to use their benefits. A sizable share of adults report uncertainty about what their insurance covers for mental health.
Platform data from Grow Therapy shows large differences in patient out-of-pocket costs depending on insurance use versus cash pay in certain markets, illustrating how coverage can change the financial barrier to care.
Safety shapes rankings more than it gets credit for
More than a quarter of survey respondents named low crime as a top factor. Cities with low violent crime rates often rise in the rankings even if provider density is modest, because safety affects daily stress and whether people can easily access neighborhood services. Park access also matters: regular time in green space is linked to lower stress and better mental health outcomes.
The access gap — when cost, coverage, and provider supply all work against you
Access breaks down when several barriers come together: high housing costs, limited providers, unclear insurance coverage, or poor broadband for telehealth. Affordability is the most common immediate obstacle. Twenty-one percent of Americans have skipped mental health care because the out-of-pocket cost was too high; others face confusion over coverage.
Regional perceptions vary
Perceptions of affordability differ by region. Northeast respondents are most likely to say care feels unaffordable, while the Midwest reports the most uncertainty. High levels of uncertainty in a region may indicate limited contact with the mental health system and its costs, which itself is an access challenge.
Structural barriers don’t always come from the same direction
Different cities show different combinations of strengths and constraints. Arlington, TX, for example, has low rent burden and good income equality but a high uninsured rate that limits access for people without coverage. Memphis illustrates the opposite issue: multiple disadvantages—high violent crime, low broadband access, heavy rent burdens, and pronounced income inequality—stack to reduce access dramatically.
Getting an appointment is a barrier too
Half of Americans expect difficulty getting a first appointment or aren’t sure how hard it will be. National data estimate an average wait time for behavioral health services around 48 days, though some platforms and providers report much shorter typical waits when they can match patients quickly. Telehealth has reduced geographic barriers for many, but access still depends on broadband, cost, and licensing rules.
Finding support where you are
No city in this analysis is perfect, and no city is hopeless. The most successful places combine reasonable housing costs, broad coverage, a stable provider supply, reliable broadband, and safe neighborhoods. For many Americans who do not live in a top-ranked city, telehealth has expanded options and made it easier to find a therapist who accepts their insurance—though state licensure rules and internet access still shape what’s available.
If cost concerns have prevented you from seeking therapy, it’s worth checking what your insurance actually covers and exploring virtual options that can widen the pool of available providers. Local and national resources, employer plans, and community clinics may offer lower-cost pathways to care.
Wherever you live, prioritizing affordable coverage, transparent benefit information, and safe, connected neighborhoods will make mental health support more reachable for more people.
Methodology
This analysis combined three data sources: a city scoring study, a national consumer survey, and proprietary platform data from Grow Therapy. We compared the 50 most populous U.S. cities using a weighted scoring model across eight variables:
- Mental health providers per 100,000 residents (15 points)
- Mental Health Professional Shortage Area (HPSA) score (15 points)
- Uninsured rate (10 points)
- Rent burden (15 points)
- Income inequality (Gini coefficient) (10 points)
- Broadband access (10 points)
- Violent crime rate per 100,000 residents (13 points)
- Park access — share of residents within a 10-minute walk of a park (12 points)
For measures where lower values are worse (for example, violent crime and uninsured rate), scoring was inverted so higher point totals always reflect better outcomes. Data reflect the most recently available years at the time of analysis (2022–2025). Missing city-level data for some measures was prorated across remaining variables. The consumer survey was conducted by YouGov for Grow Therapy in February 2026 with 1,203 U.S. adults and is weighted to be representative of the adult population.
Grow Therapy’s platform data informs trends such as provider availability, typical wait times, insurance utilization, and telehealth use across major U.S. metropolitan areas. Platform metrics reflect state-level licensing and virtual practice patterns rather than city-specific supply for some variables.